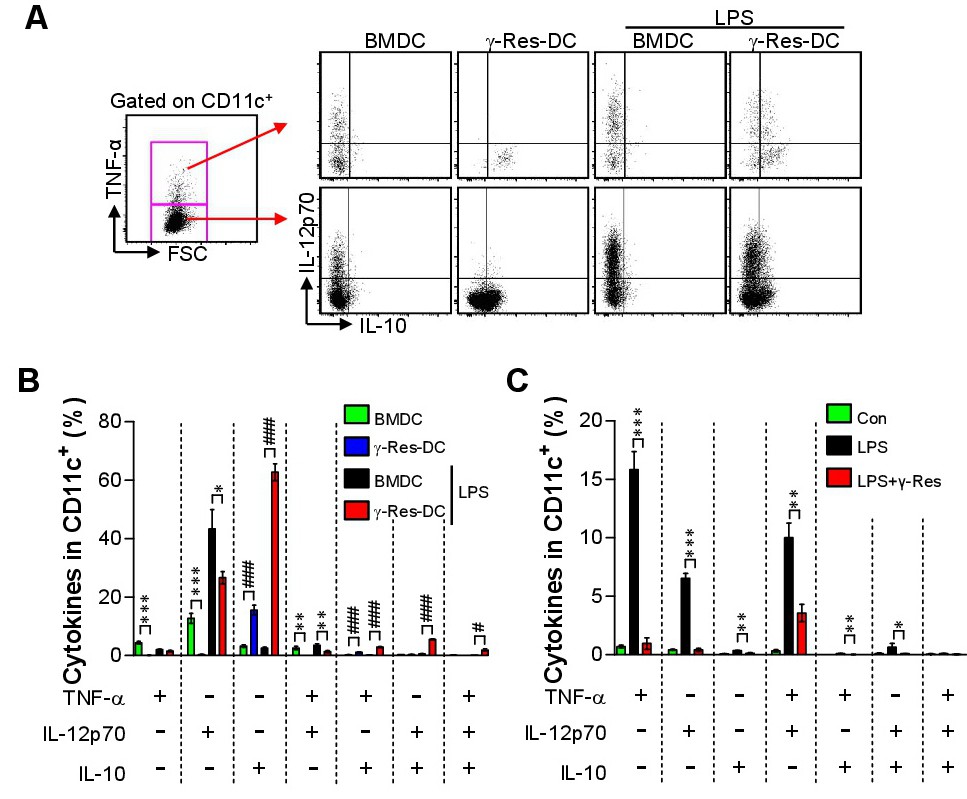
Fig. 4. Intracellular cytokine production in γ-Res-treated BMDCs and DCs generated by γ-Res in the presence of LPS. A) The BMDCs and γ-Res-DCs were incubated with LPS (100 ng/mL) in the presence of GolgiPlug for 12 h, and stained with anti-TNF-α, anti-IL-12p70, anti-IL-10, and anti-CD11c Abs. Intracellular levels of TNF-α, IL-12p70 and IL-10 in CD11c+ cells were analyzed by flow cytometry. B) The bar graph shows the mean ± SD (n = 3 samples per group) of the percentage of intracellular cytokine levels in BMDCs and γ-Res-DCs. C) BMDCs were treated with LPS (100 ng/mL) or LPS with γ-Res (30 μg/mL) in the presence of GolgiPlug for 12 h. Intracellular levels of TNF-α, IL-12p70 and IL-10 were analyzed by flow cytometry. All results are representative of three independent experiments. All bar graphs show the means ± SD of three samples per group. *p<0.05, **p<0.01, or ***p<0.001.